
The Erythrocyte Sedimentation Rate and Its Relation to Cell Shape and Rigidity of Red Blood Cells from Chorea-Acanthocytosis Patients in an Off-Label Treatment with Dasatinib

 , , , , ,
  and
and 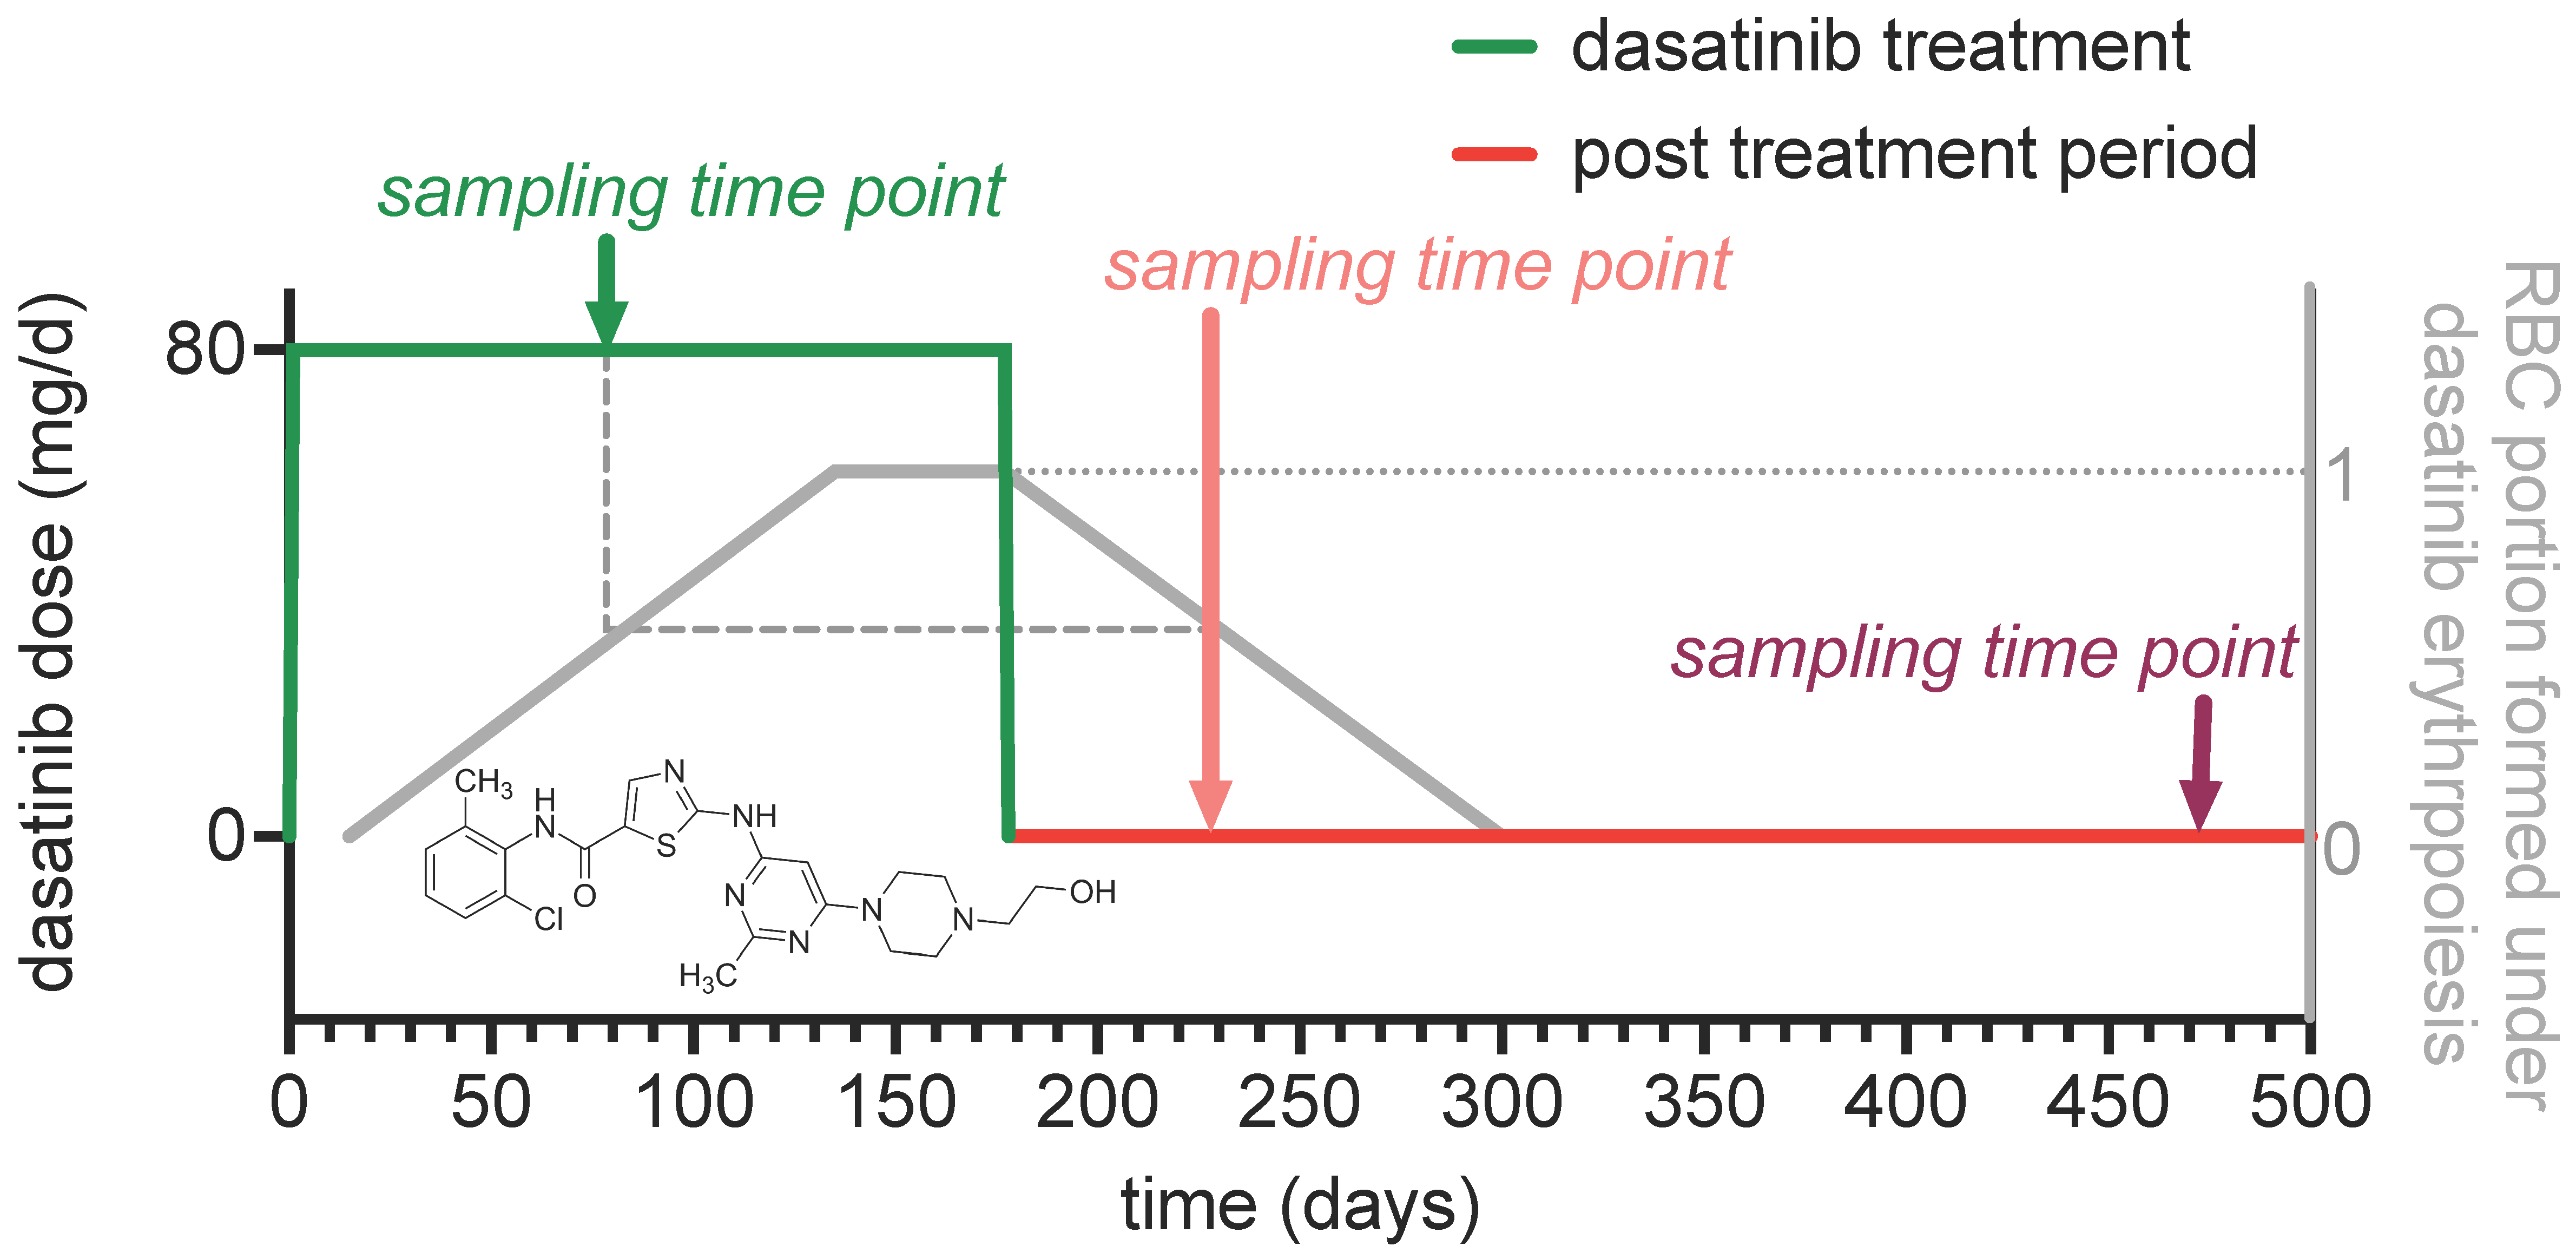
Abstract
:1. Introduction
2. Materials and Methods
2.1. Blood Collection
2.2. Dasatinib Treatment
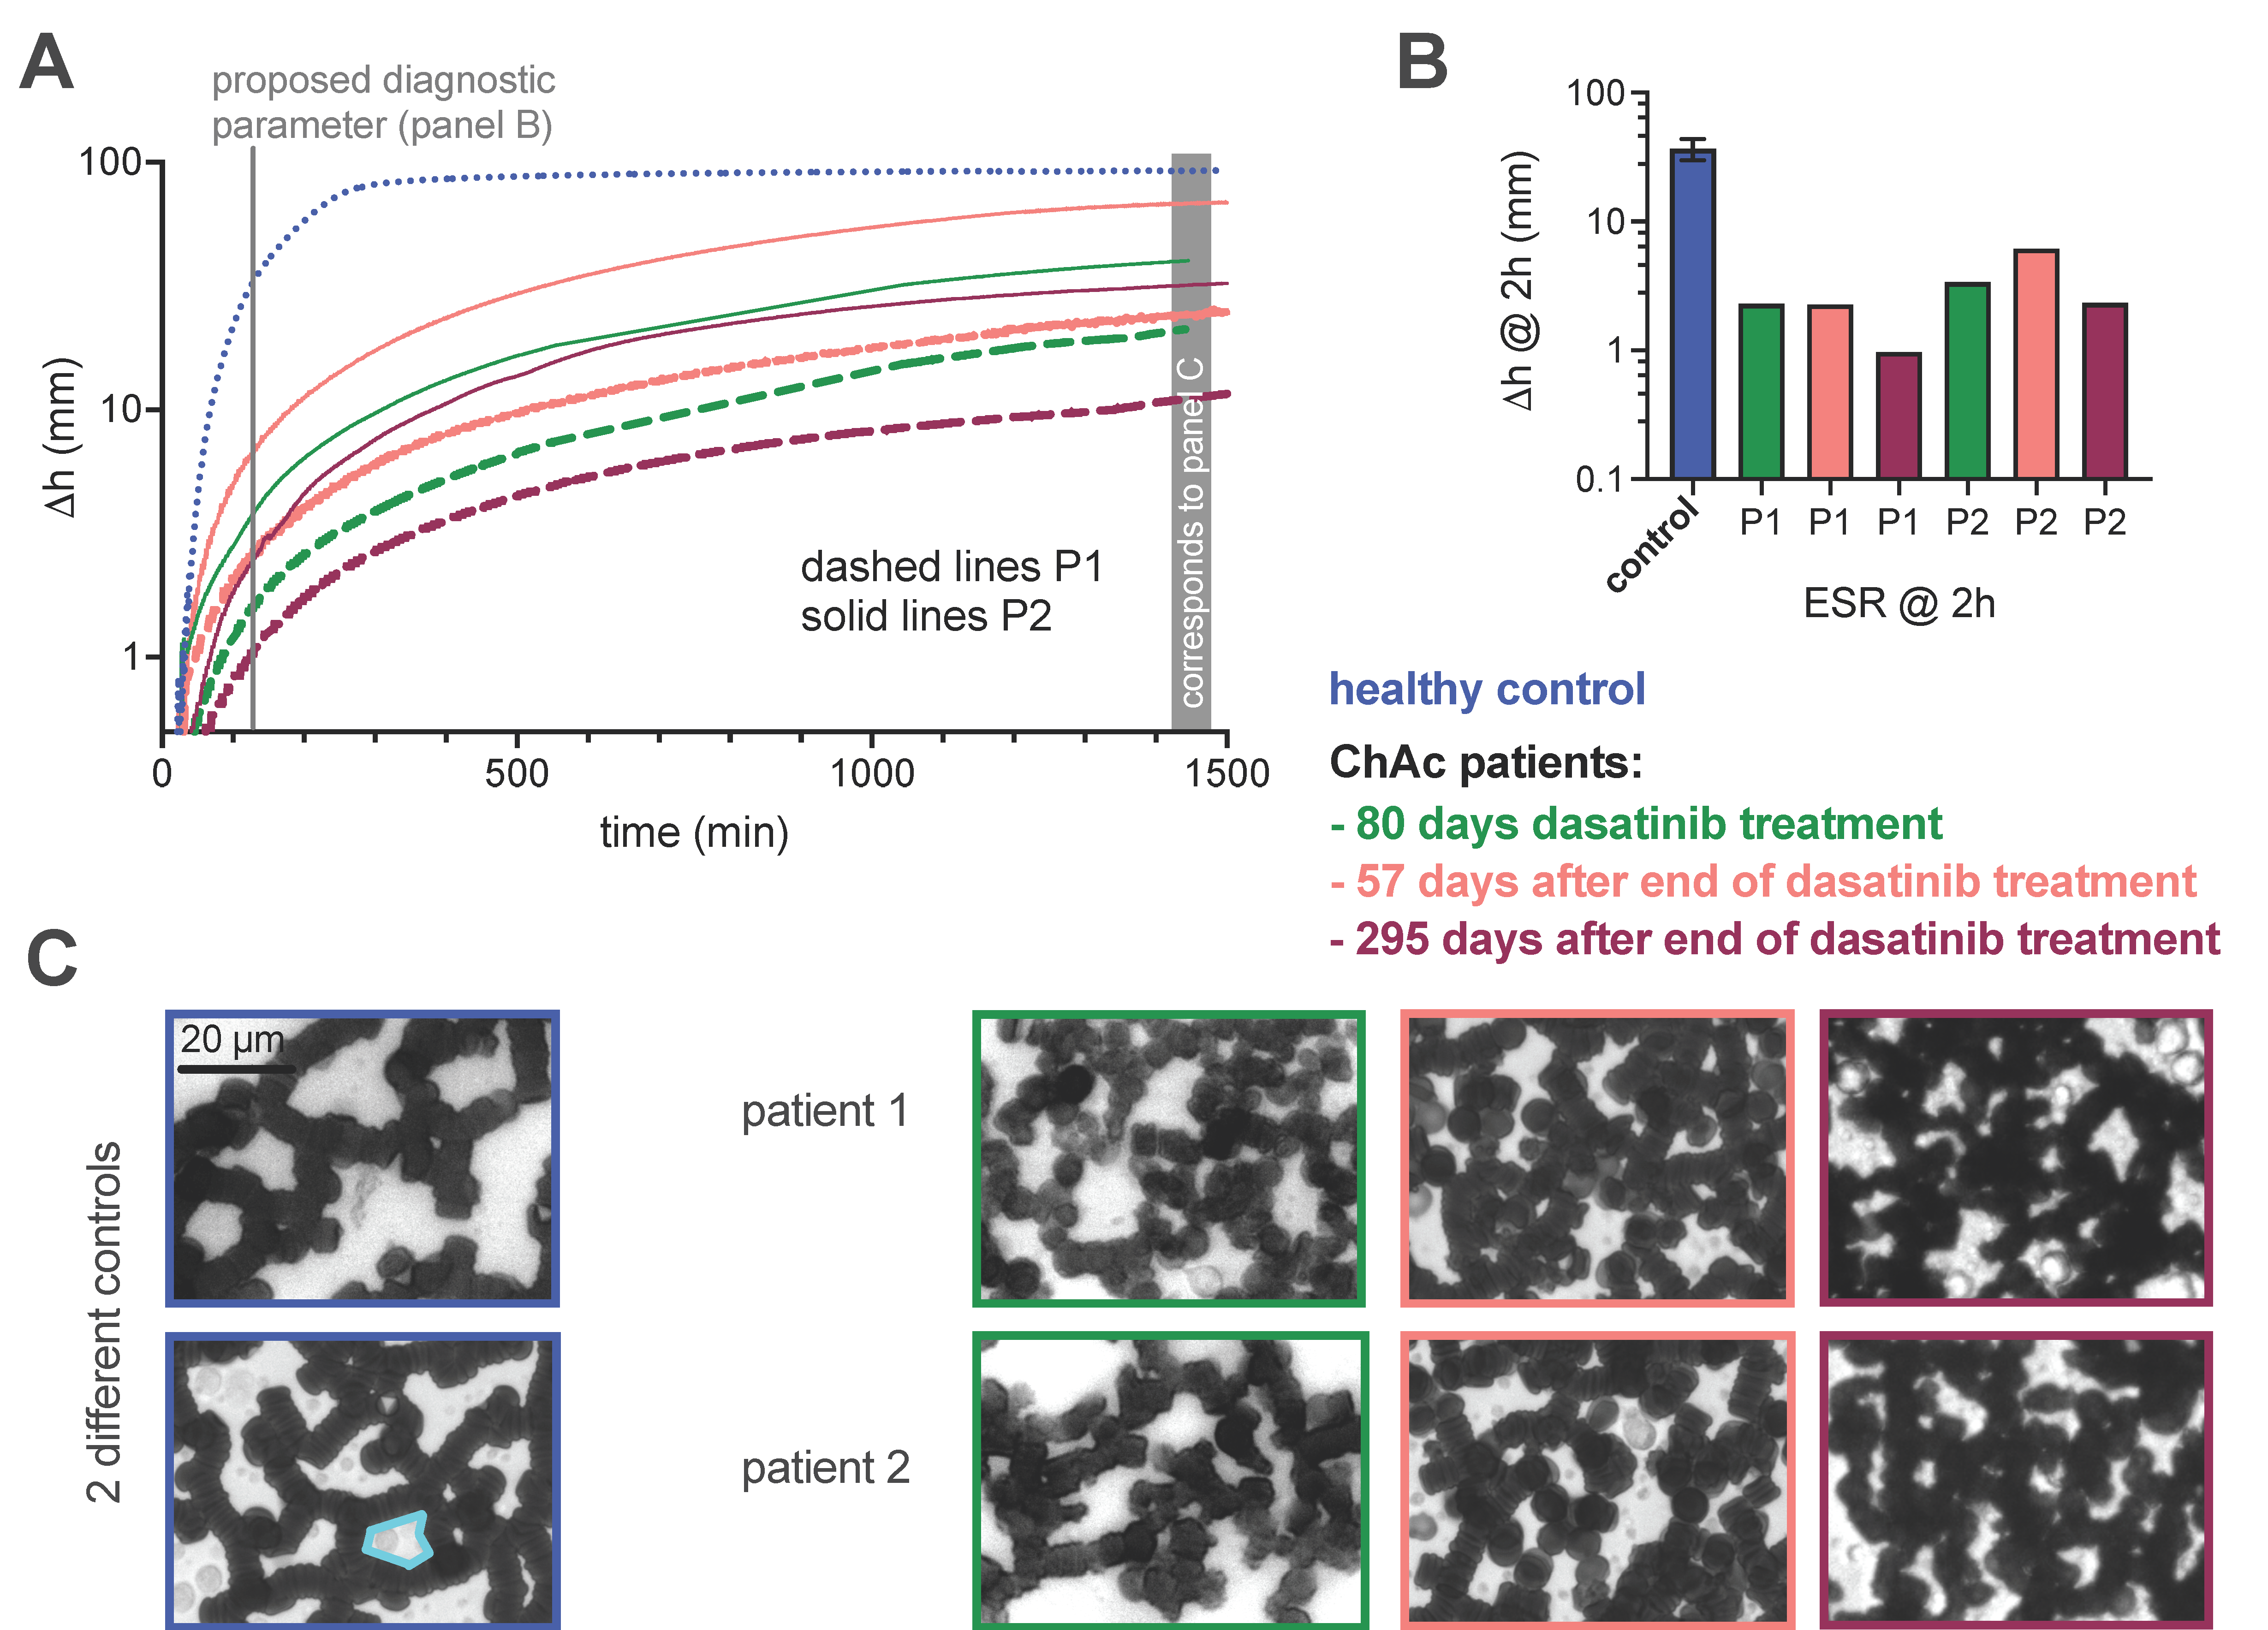
2.3. Determination of the Erythrocyte Sedimentation Parameters
2.4. Selection and Determination of Clinical Laboratory Parameters
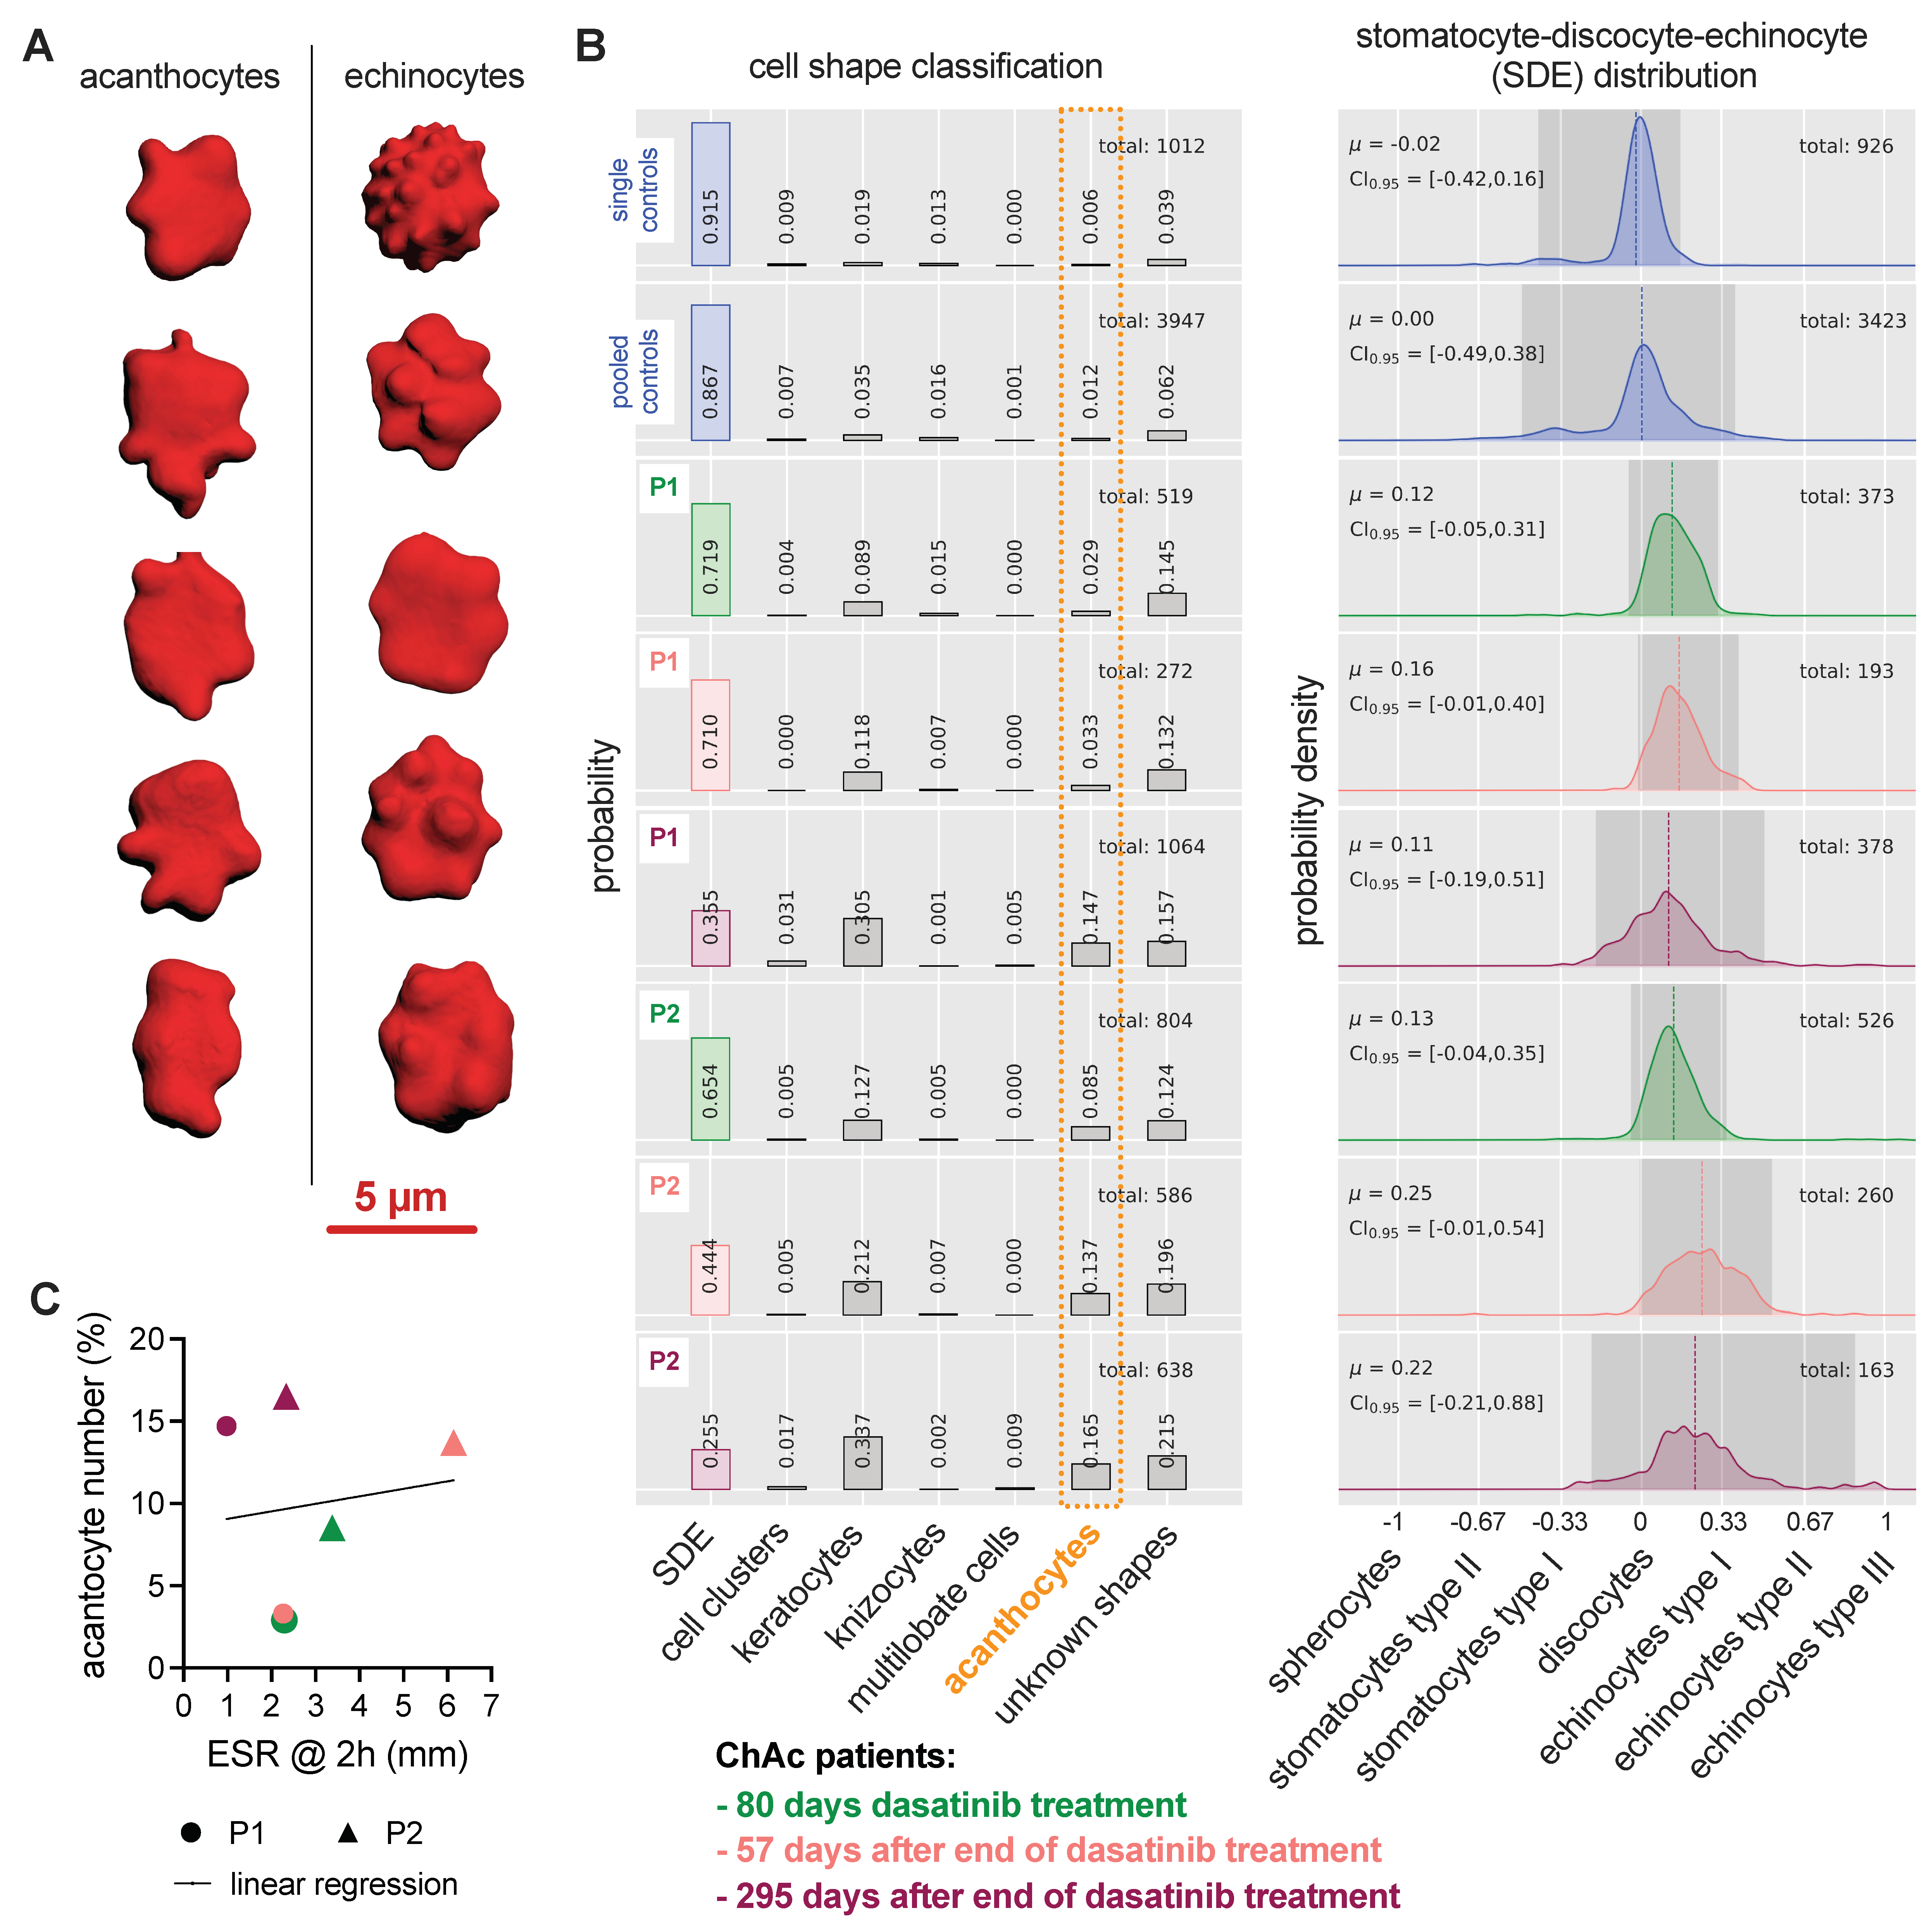
2.5. Erythrocyte 3D Recordings and Shape Classification
2.6. Microfluidic Measurements
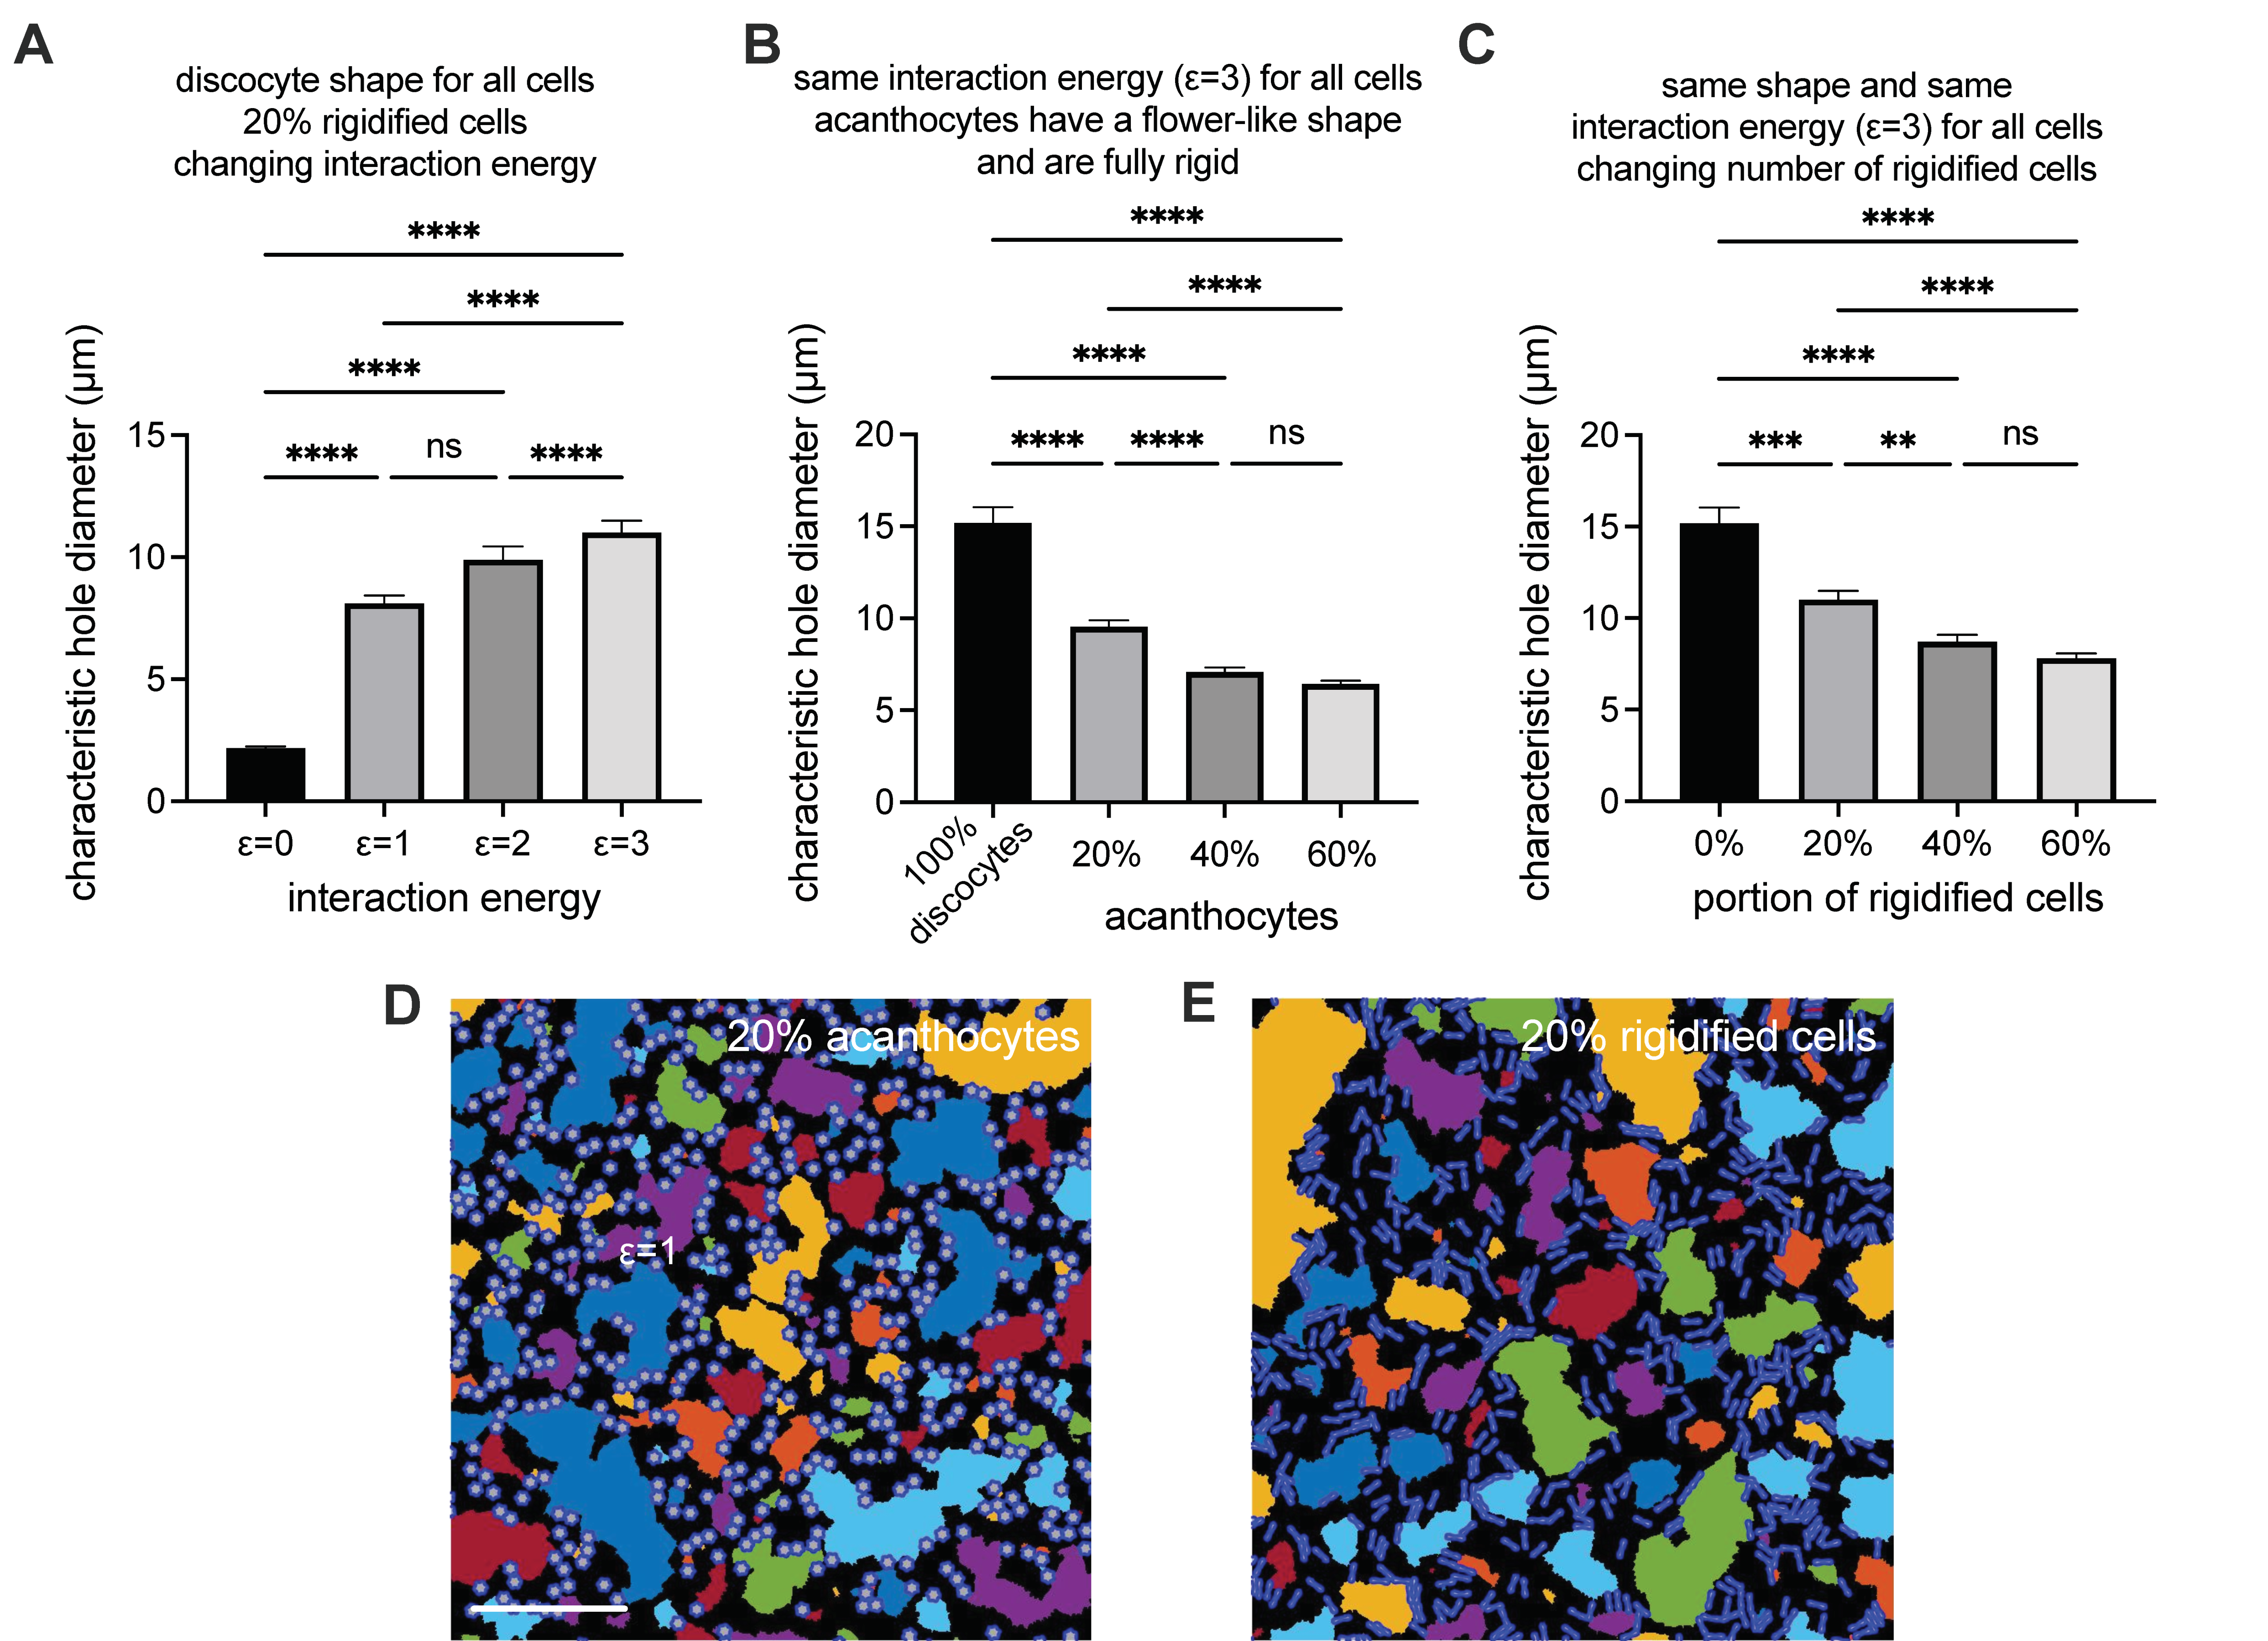
2.7. Aggregate 2D Simulatioons
2.8. Statistical Analysis
3. Results
3.1. The Dasatinib Off-Label Treatment
3.2. Determination of the Erythrocyte Sedimentation Parameters
3.3. Evaluation of Clinical Laboratory Parameters
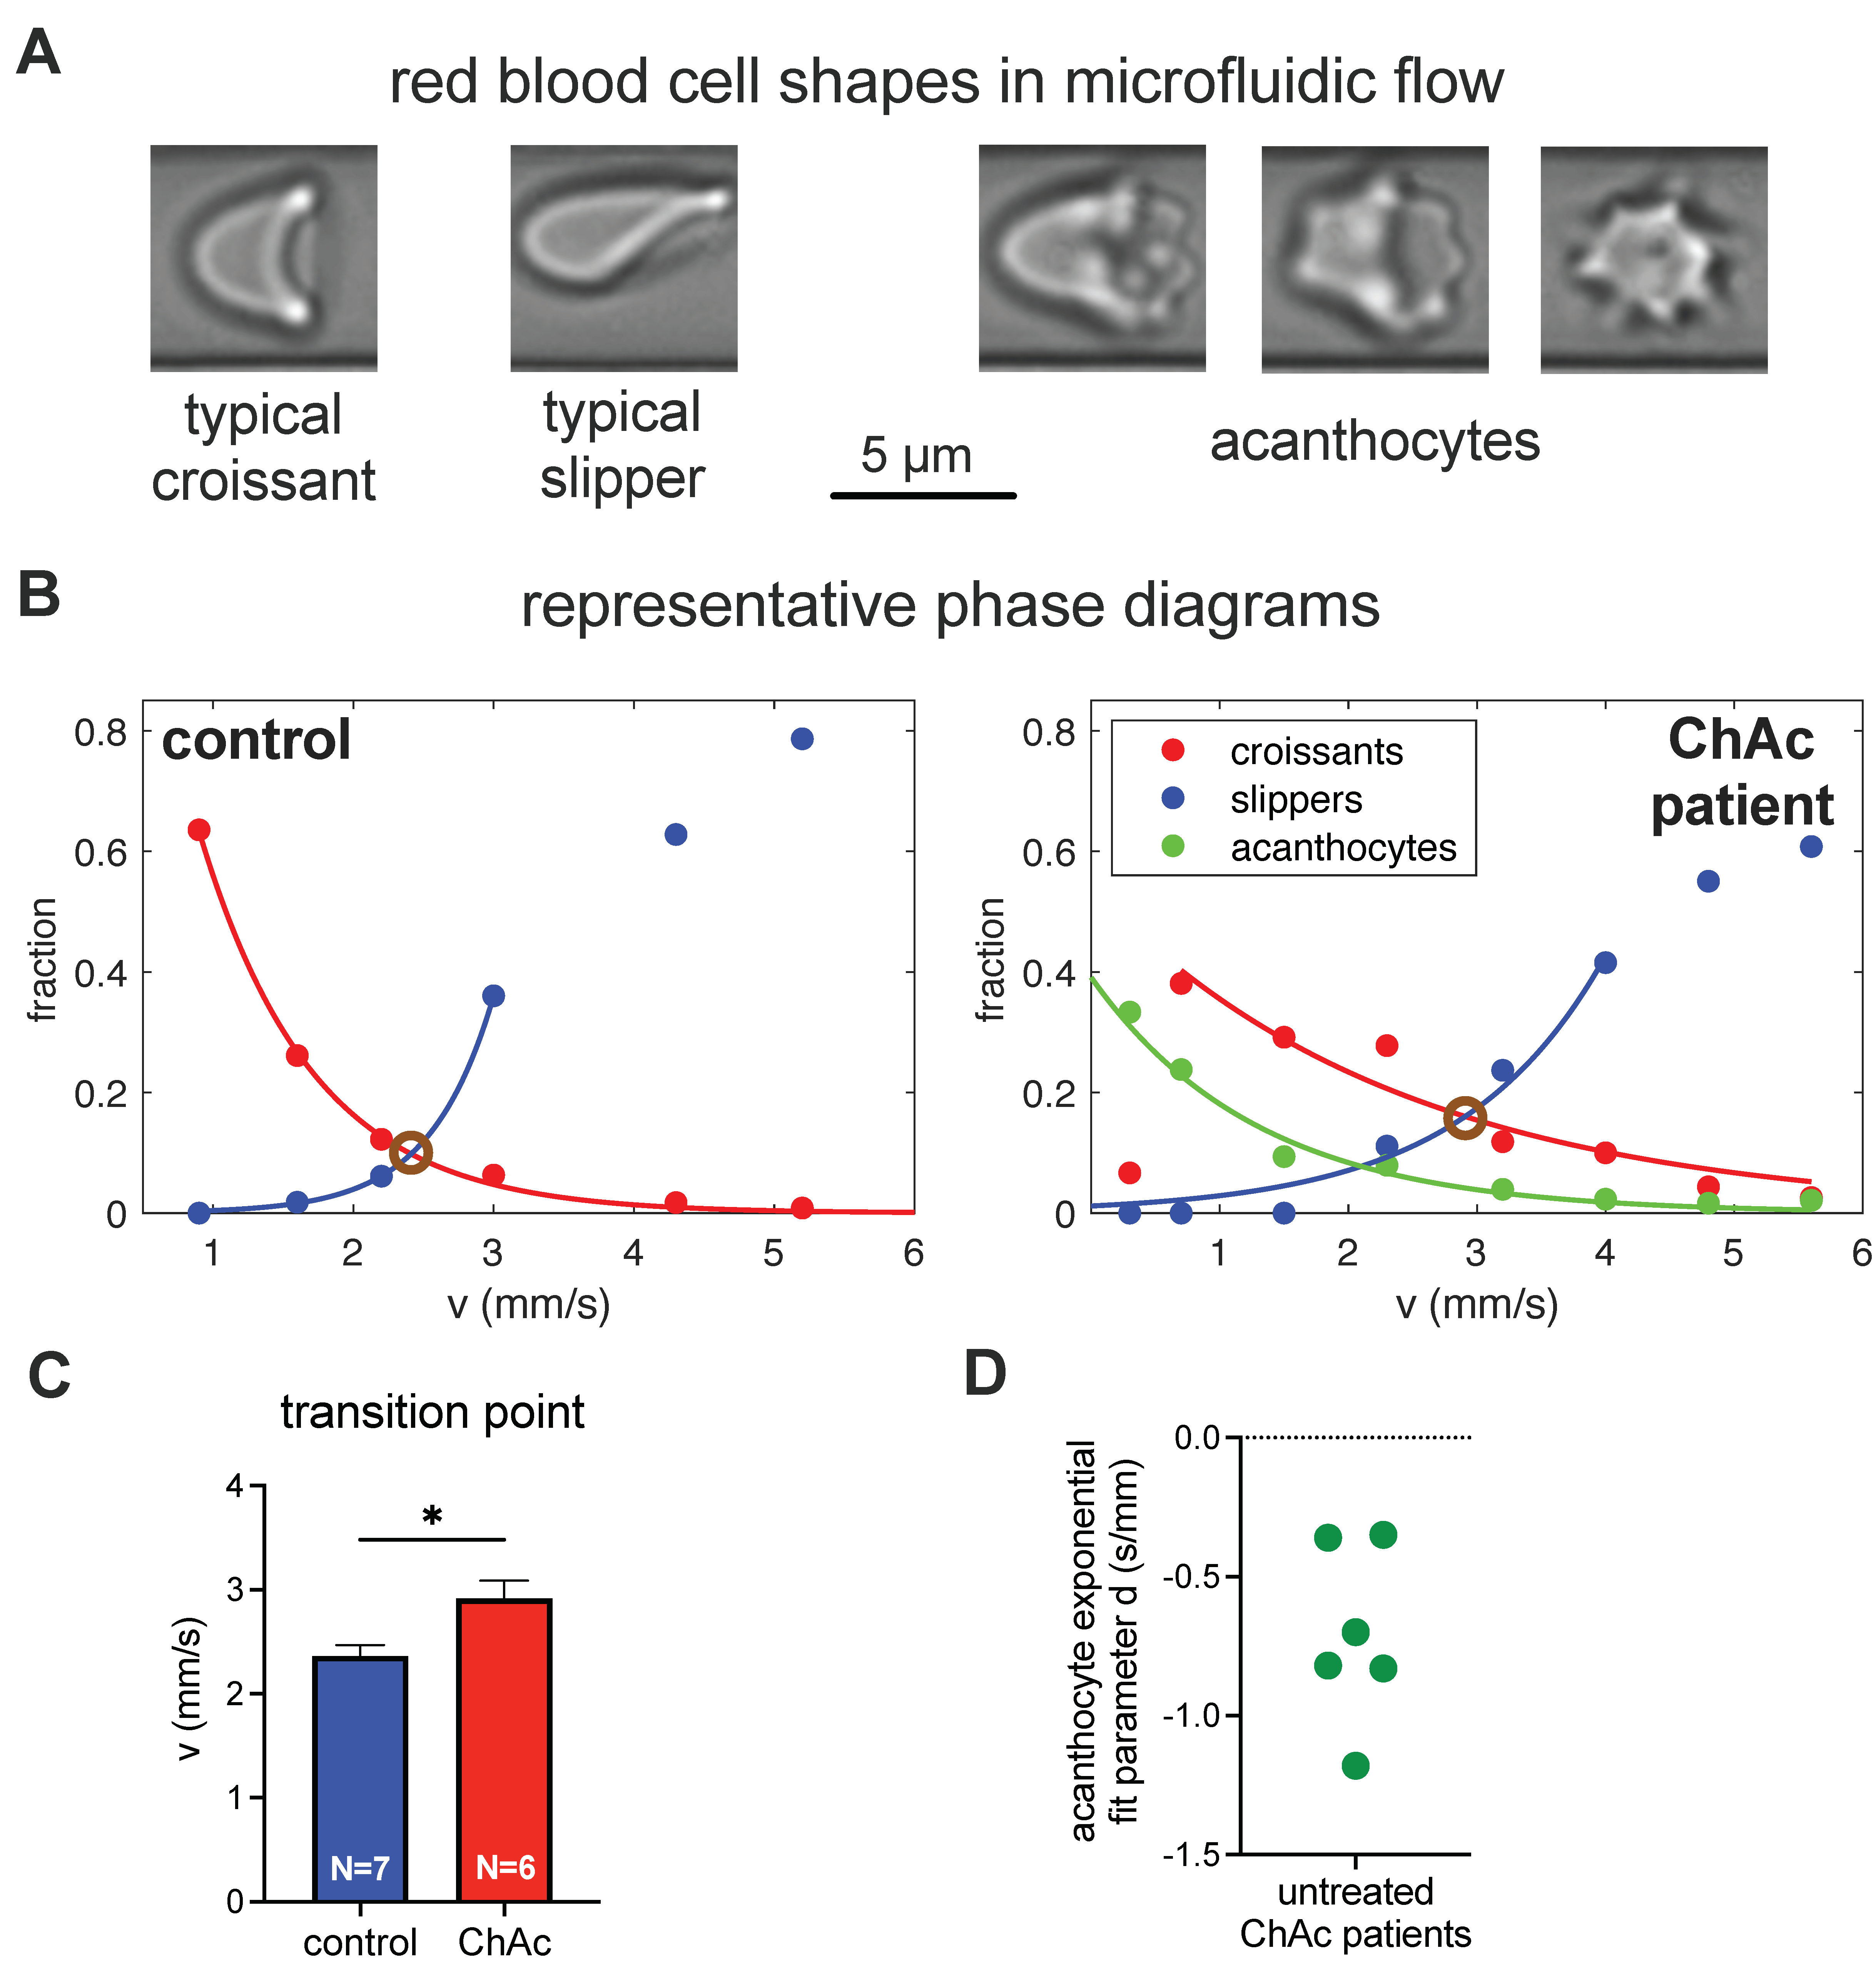
3.4. Erythrocyte Shape Classification
3.5. Modeling of RBC Aggregation
3.6. Erythrocyte Phase Diagram-Derived Parameters
4. Discussion
5. Conclusions
Supplementary Materials
Author Contributions
Funding
Institutional Review Board Statement
Informed Consent Statement
Data Availability Statement
Acknowledgments
Conflicts of Interest
References
- Peikert, K.; Danek, A.; Hermann, A. Current State of Knowledge in Chorea-Acanthocytosis as Core Neuroacanthocytosis Syndrome. Eur. J. Med. Genet. 2017, 61, 699–705. [Google Scholar] [CrossRef] [PubMed]
- Adjobo-Hermans, M.J.W.; Cluitmans, J.C.A.; Bosman, G.J.C.G.M. Neuroacanthocytosis: Observations, Theories and Perspectives on the Origin and Significance of Acanthocytes. Tremor Other Hyperkinetic Mov. 2015, 5, 328. [Google Scholar] [CrossRef]
- Walker, R.H.; Miranda, M.; Jung, H.H.; Danek, A. Life Expectancy and Mortality in Chorea-Acanthocytosis and McLeod Syndrome. Parkinsonism Relat. D 2018, 60, 158–161. [Google Scholar] [CrossRef] [PubMed]
- Lupo, F.; Tibaldi, E.; Matte, A.; Sharma, A.K.; Brunati, A.M.; Alper, S.L.; Zancanaro, C.; Benati, D.; Siciliano, A.; Bertoldi, M.; et al. A New Molecular Link between Defective Autophagy and Erythroid Abnormalities in Chorea-Acanthocytosis. Blood 2016, 128, 2976–2987. [Google Scholar] [CrossRef] [PubMed] [Green Version]
- Peikert, K.; Federti, E.; Matte, A.; Constantin, G.; Pietronigro, E.C.; Fabene, P.F.; Defilippi, P.; Turco, E.; Gallo, F.D.; Pucci, P.; et al. Therapeutic Targeting of Lyn Kinase to Treat Chorea-Acanthocytosis. Acta Neuropathol. Commun. 2021, 9, 81. [Google Scholar] [CrossRef]
- Peikert, K.; Glaß, H.; Federti, E.; Matte, A.; Pelzl, L.; Akgün, K.; Ziemssen, T.; Ordemann, R.; Lang, F.; The Network for translational research for Neuroacanthocytosis Patients, Lucia De Franceschi. Targeting Lyn Kinase in Chorea-Acanthocytosis: A Translational Treatment Approach in a Rare Disease. medRxiv 2021. accepted. [Google Scholar] [CrossRef]
- Steegmann, J.L.; Baccarani, M.; Breccia, M.; Casado, L.F.; García-Gutiérrez, V.; Hochhaus, A.; Kim, D.-W.; Kim, T.D.; Khoury, H.J.; Coutre, P.L.; et al. European LeukemiaNet Recommendations for the Management and Avoidance of Adverse Events of Treatment in Chronic Myeloid Leukaemia. Leukemia 2016, 30, 1648–1671. [Google Scholar] [CrossRef] [PubMed] [Green Version]
- Storch, A.; Kornhass, M.; Schwarz, J. Testing for Acanthocytosis. J. Neurol. 2005, 252, 84–90. [Google Scholar] [CrossRef]
- Rampoldi, L.; Danek, A.; Monaco, A.P. Clinical Features and Molecular Bases of Neuroacanthocytosis. J. Mol. Med. 2002, 80, 475–491. [Google Scholar] [CrossRef]
- Darras, A.; Peikert, K.; Rabe, A.; Yaya, F.; Simionato, G.; John, T.; Dasanna, A.K.; Buvalyy, S.; Geisel, J.; Hermann, A.; et al. Acanthocyte Sedimentation Rate as a Diagnostic Biomarker for Neuroacanthocytosis Syndromes: Experimental Evidence and Physical Justification. Cells 2021, 10, 788. [Google Scholar] [CrossRef]
- Scheid, R.; Bader, B.; Ott, D.V.; Merkenschlager, A.; Danek, A. Development Of Mesial Temporal Lobe Epilepsy in Chorea-Acanthocytosis. Neurology 2009, 73, 1419–1422. [Google Scholar] [CrossRef]
- Makhro, A.; Huisjes, R.; Verhagen, L.P.; Mañú-Pereira, M.d.M.; Llaudet-Planas, E.; Petkova-Kirova, P.; Wang, J.; Eichler, H.; Bogdanova, A.; van Wijk, R.; et al. Red Cell Properties after Different Modes of Blood Transportation. Front. Physiol 2016, 7, 288. [Google Scholar] [CrossRef] [Green Version]
- Hertz, L.; Huisjes, R.; Llaudet-Planas, E.; Petkova-Kirova, P.; Makhro, A.; Danielczok, J.G.; Egée, S.; Mañú-Pereira, M.D.M.; van Wijk, R.; Vives-Corrons, J.-L.; et al. Is Increased Intracellular Calcium in Red Blood Cells a Common Component in the Molecular Mechanism Causing Anemia? Front. Physiol. 2017, 8, 673. [Google Scholar] [CrossRef] [Green Version]
- Abay, A.; Simionato, G.; Chachanidze, R.; Bogdanova, A.; Hertz, L.; Bianchi, P.; van den Akker, E.; von Lindern, M.; Leonetti, M.; Minetti, G.; et al. Glutaraldehyde—A Subtle Tool in the Investigation of Healthy and Pathologic Red Blood Cells. Front. Physiol. 2019, 10, 514. [Google Scholar] [CrossRef] [PubMed]
- Hertz, L.; Ruppenthal, S.; Simionato, G.; Quint, S.; Kihm, A.; Abay, A.; Petkova-Kirova, P.; Boehm, U.; Weissgerber, P.; Wagner, C.; et al. The Evolution of Erythrocytes Becoming Red in Respect to Fluorescence. Front. Physiol. 2019, 10, 753. [Google Scholar] [CrossRef] [PubMed] [Green Version]
- Simionato, G.; Hinkelmann, K.; Chachanidze, R.; Bianchi, P.; Fermo, E.; van Wijk, R.; Leonetti, M.; Wagner, C.; Kaestner, L.; Quint, S. Red Blood Cell Phenotyping from 3D Confocal Images Using Artificial Neural Networks. PLoS Comput. Biol. 2021, accepted. [Google Scholar] [CrossRef]
- Abay, A.; Recktenwald, S.M.; John, T.; Kaestner, L.; Wagner, C. Cross-Sectional Focusing of Red Blood Cells in a Constricted Microfluidic Channel. Soft Matter 2019, 16, 534–543. [Google Scholar] [CrossRef] [PubMed] [Green Version]
- Kihm, A.; Kaestner, L.; Wagner, C.; Quint, S. Classification of Red Blood Cell Shapes in Flow Using Outlier Tolerant Machine Learning. PLoS Comput. Biol. 2018, 14, e1006278. [Google Scholar] [CrossRef] [Green Version]
- Guckenberger, A.; Kihm, A.; John, T.; Wagner, C.; Gekle, S. Numerical–Experimental Observation of Shape Bistability of Red Blood Cells Flowing in a Microchannel. Soft Matter 2018, 14, 2032–2043. [Google Scholar] [CrossRef] [Green Version]
- Quint, S.; Christ, A.F.; Guckenberger, A.; Himbert, S.; Kaestner, L.; Gekle, S.; Wagner, C. 3D Tomography of Cells in Micro-Channels. Appl. Phys. Lett. 2017, 111, 103701. [Google Scholar] [CrossRef] [Green Version]
- Zhang, Z.; Henry, E.; Gompper, G.; Fedosov, D.A. Behavior of Rigid and Deformable Particles in Deterministic Lateral Displacement Devices with Different Post Shapes. J. Chem. Phys. 2015, 143, 243145. [Google Scholar] [CrossRef] [Green Version]
- Fedosov, D.A.; Fornleitner, J.; Gompper, G. Margination of White Blood Cells in Microcapillary Flow. Phys. Rev. Lett. 2012, 108, 028104. [Google Scholar] [CrossRef] [PubMed] [Green Version]
- Aglialoro, F.; Abay, A.; Yagci, N.; Rab, M.A.E.; Kaestner, L.; van Wijk, R.; von Lindern, M.; van den Akker, E. Mechanical Stress Induces Ca2+-Dependent Signal Transduction in Erythroblasts and Modulates Erythropoiesis. Int. J. Mol. Sci. 2021, 22, 955. [Google Scholar] [CrossRef]
- Klein, M.; Kaestner, L.; Bogdanova, A.; Minetti, G.; Rudloff, S.; Lundby, C.; Makhro, A.; Seiler, E.; van Cromvoirt, A.; Fenk, S.; et al. Absence of Neocytolysis in Humans Returning from a Three-Week High-Altitude Sojourn. Acta Physiol. 2021. [Google Scholar] [CrossRef]
- Flormann, D.; Kuder, E.; Lipp, P.; Wagner, C.; Kaestner, L. Is There a Role of C-reactive Protein in Red Blood Cell Aggregation? Int. J. Lab. Hematol. 2015, 37, 474–482. [Google Scholar] [CrossRef]
- Lim, G.; Wortis, M.; Mukhopadhyay, R. Stomatocyte-Discocyte-Echinocyte Sequence of the Human Red Blood Cell: Evidence for the Bilayer- Couple Hypothesis from Membrane Mechanics. Proc. Natl. Acad. Sci. USA 2002, 99, 16766–16769. [Google Scholar] [CrossRef] [PubMed] [Green Version]
- Lanotte, L.; Mauer, J.; Mendez, S.; Fedosov, D.A.; Fromental, J.-M.; Claveria, V.; Nicoud, F.; Gompper, G.; Abkarian, M. Red Cells’ Dynamic Morphologies Govern Blood Shear Thinning under Microcirculatory Flow Conditions. Proc. Natl. Acad. Sci. USA 2016, 113, 13289–13294. [Google Scholar] [CrossRef] [PubMed] [Green Version]
- Baskurt, O.; Neu, B.; Meiselman, H.J. Red Blood Cell Aggregation; CRC Press: Boca Raton, FL, USA, 2012. [Google Scholar]
- Peikert, K.; Akgün, K.; Beste, C.; Ziemssen, T.; Buhmann, C.; Danek, A.; Hermann, A. Neurofilament Light Chain in Serum Is Significantly Increased in Chorea-Acanthocytosis. Parkinsonism Relat. D 2020, 80, 28–31. [Google Scholar] [CrossRef]
- Brust, M.; Aouane, O.; Thiébaud, M.; Flormann, D.; Verdier, C.; Kaestner, L.; Laschke, M.W.; Selmi, H.; Benyoussef, A.; Podgorski, T.; et al. The Plasma Protein Fibrinogen Stabilizes Clusters of Red Blood Cells in Microcapillary Flows. Sci. Rep. 2014, 4, 4348. [Google Scholar] [CrossRef] [Green Version]
- Flormann, D.; Aouane, O.; Kaestner, L.; Ruloff, C.; Misbah, C.; Podgorski, T.; Wagner, C. The Buckling Instability of Aggregating Red Blood Cells. Sci. Rep. 2017, 7, 7928. [Google Scholar] [CrossRef] [Green Version]
- Shohet, S.B.; Lux, S.E. The Erythrocyte Membrane Skeleton: Pathophysiology. Hosp. Pract. 2016, 19, 89–108. [Google Scholar] [CrossRef] [PubMed]
- Cluitmans, J.C.A.; Tomelleri, C.; Yapici, Z.; Dinkla, S.; Bovee-Geurts, P.; Chokkalingam, V.; Franceschi, L.D.; Brock, R.; Bosman, G.J.G.C.M. Abnormal Red Cell Structure and Function in Neuroacanthocytosis. PLoS ONE 2015, 10, e0125580. [Google Scholar] [CrossRef] [PubMed]


Publisher’s Note: MDPI stays neutral with regard to jurisdictional claims in published maps and institutional affiliations. |
© 2021 by the authors. Licensee MDPI, Basel, Switzerland. This article is an open access article distributed under the terms and conditions of the Creative Commons Attribution (CC BY) license (https://creativecommons.org/licenses/by/4.0/).
Share and Cite
Rabe, A.; Kihm, A.; Darras, A.; Peikert, K.; Simionato, G.; Dasanna, A.K.; Glaß, H.; Geisel, J.; Quint, S.; Danek, A.; et al. The Erythrocyte Sedimentation Rate and Its Relation to Cell Shape and Rigidity of Red Blood Cells from Chorea-Acanthocytosis Patients in an Off-Label Treatment with Dasatinib. Biomolecules 2021, 11, 727. https://doi.org/10.3390/biom11050727
Rabe A, Kihm A, Darras A, Peikert K, Simionato G, Dasanna AK, Glaß H, Geisel J, Quint S, Danek A, et al. The Erythrocyte Sedimentation Rate and Its Relation to Cell Shape and Rigidity of Red Blood Cells from Chorea-Acanthocytosis Patients in an Off-Label Treatment with Dasatinib. Biomolecules. 2021; 11(5):727. https://doi.org/10.3390/biom11050727
Chicago/Turabian StyleRabe, Antonia, Alexander Kihm, Alexis Darras, Kevin Peikert, Greta Simionato, Anil Kumar Dasanna, Hannes Glaß, Jürgen Geisel, Stephan Quint, Adrian Danek, and et al. 2021. "The Erythrocyte Sedimentation Rate and Its Relation to Cell Shape and Rigidity of Red Blood Cells from Chorea-Acanthocytosis Patients in an Off-Label Treatment with Dasatinib" Biomolecules 11, no. 5: 727. https://doi.org/10.3390/biom11050727